Northern Policy Institute Community Accounts is now live and available to the public! As this is a new release, there may be occasional bugs encountered as we implement different features. If you encounter any issues, please contact us at data@northernpolicy.ca. Thank you!
NORTHERN ONTARIO'S COMMUNITY ACCOUNTS
sharing DATA providing INFORMATION developing KNOWLEDGE
Personal or household income is generally regarded as the single best measure of the degree to which people are "well off." Our concept of well-being includes more than economic indicators
and takes the approach that other factors such as health and education play a part in determining a community's or region's well-being.
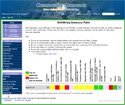
About the Colors:
In order to answer the question, "How is the area doing relative to all other communities in the province?"
we take each community and line them up from lowest to highest based on the indicator values.
This gives us our entire range of values. We then take the closest match to the lower 25% of communities, the middle 50% of communities,
and the upper 25% of communities. The range of values representing this bottom range of communities is colored
red, the top range is colored green and the range of values representing the middle group of communities is colored yellow. We
then show where the value for your chosen geography falls (represented by the colored square), and from this
you can determine how a community or region is doing compared to all communities in the province.
The median After-tax income of households in the geography.
2016 Median Individual After-tax Income
This indicator is currently unavailable or is being updated.1
Analytical Features
Indicator Summary Table (All Indicators)
Displays all the indicators as a grid of color. This can be used to display ranges for many geographies at once. Values can
also be displayed, and each grid square connects to the related Well-Being Chart.
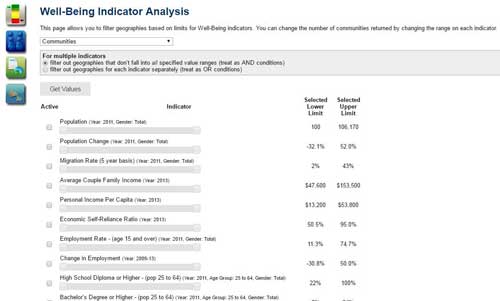
Queries the Well-Being data for the most recent year available for which Communities fall within the ranges you select, for the
Well-Being Indicators you select.
 providing INFORMATION
  Well-Being Indicators
 Profiles
 Tables and Charts
 Map Centre